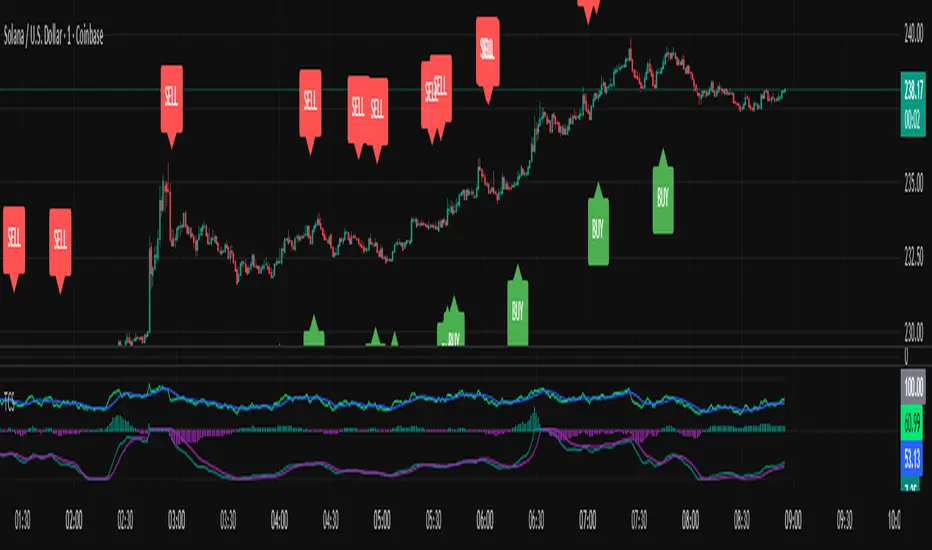
oscillator fast cryptosmart (Bands on Scale)The oscillator fast cryptosmart is a high-sensitivity momentum indicator designed to generate signals more rapidly than many traditional oscillators, such as the MACD. It is engineered to detect potential price breakouts by analyzing short-term market cycles.
At its core, the indicator uses a Detrended Price Oscillator (DPO) to remove the longer-term trend from price action, allowing it to focus purely on the underlying momentum cycles. It then calculates dynamic volatility bands around this oscillator line.
Signals are generated when momentum breaks out from a normal range, providing traders with an early warning of a potential acceleration in price.
How to Interpret the Signals:
Buy Signal (Green Vertical Line): A buy signal is generated when the oscillator's main line (yellow) crosses above its upper statistical band. This indicates a sharp surge in positive momentum, suggesting a potential upward move is beginning.
Sell Signal (Red Vertical Line): A sell signal is generated when the oscillator's main line crosses below its lower statistical band. This indicates a significant increase in negative momentum, suggesting a potential downward move is starting.
By focusing on momentum breakouts rather than lagging moving average crossovers, the oscillator fast cryptosmart aims to provide an edge in identifying opportunities in fast-moving markets.
Поиск скриптов по запросу "moving average crossover"

Triple Confirmation StrategyTriple Confirmation Strategy (TCS)
This indicator combines three different technical tools to provide more reliable entry signals:
RSI + Moving Average crossover → momentum confirmation
MACD line & signal crossover → trend direction signal
OBV + EMA crossover → volume-based confirmation
A signal is valid only if all three conditions occur within a given number of bars (default: 5). Optionally, it can be set to trigger only when the third confirmation happens at the current bar.
✨ Features
BUY / SELL markers on the chart
Alertcondition support → alerts can be set instantly
Grouped settings (RSI, MACD, OBV, Logic)
Diagnostic overlay (WSCD-style): RSI, MACD, and OBV visualized on a normalized –100…100 scale for easier monitoring
🎯 Usage
Suitable for both intraday and swing trading with default settings.
Parameters are fully customizable (lookback periods, bar window, diagnostic overlay).
Signals should not be used as a standalone trading system but are most effective when combined with broader context and other forms of analysis.

Triple Confirmation StrategyTriple Confirmation Strategy (TCS)
Ez az indikátor három különböző technikai eszközt kombinál a megbízhatóbb belépési jelek érdekében:
RSI + mozgóátlag keresztezés → momentum konfirmáció
MACD line & signal keresztezés → trendirány jelzés
OBV + EMA keresztezés → volumen alapú megerősítés
Egy jelzés akkor érvényes, ha mindhárom feltétel adott gyertyák számán belül (alapértelmezés: 5) teljesül. Opcionálisan beállítható, hogy csak akkor jelezzen, amikor a harmadik konfirmáció éppen megtörténik.
✨ Funkciók
BUY / SELL jelölés a chartra
Alertcondition támogatás → riasztás azonnal beállítható
Csoportosított beállítások (RSI, MACD, OBV, Logika)
Diagnosztikai overlay (WSCD-stílus): az RSI, MACD és OBV normalizált görbékkel –100…100 skálán vizuálisan is nyomon követhető
🎯 Használat
Alapbeállításokkal intraday és swing kereskedéshez is alkalmas.
A paraméterek szabadon állíthatók (ablakhosszok, gyertyaszám, diag overlay).
A jelek nem önálló kereskedési rendszerként, hanem kontextusban, más elemzésekkel együtt használva a leghatékonyabbak.
Triple Confirmation Strategy (TCS)
This indicator combines three different technical tools to provide more reliable entry signals:
RSI + Moving Average crossover → momentum confirmation
MACD line & signal crossover → trend direction signal
OBV + EMA crossover → volume-based confirmation
A signal is valid only if all three conditions occur within a given number of bars (default: 5). Optionally, it can be set to trigger only when the third confirmation happens at the current bar.
✨ Features
BUY / SELL markers on the chart
Alertcondition support → alerts can be set instantly
Grouped settings (RSI, MACD, OBV, Logic)
Diagnostic overlay (WSCD-style): RSI, MACD, and OBV visualized on a normalized –100…100 scale for easier monitoring
🎯 Usage
Suitable for both intraday and swing trading with default settings.
Parameters are fully customizable (lookback periods, bar window, diagnostic overlay).
Signals should not be used as a standalone trading system but are most effective when combined with broader context and other forms of analysis.
Momentum DivergenceOverview
The Momentum Divergence Oscillator is a valuable tool designed for traders who are familiar with basic charting but want to deepen their market insights. This indicator combines a momentum calculation with divergence detection, presenting the data in an intuitive way with a blue momentum line and colored divergence signals ("Bull" and "Bear"). It’s perfect for refining entry and exit points across various timeframes, especially for scalping or swing trading strategies.
Understanding the Concepts
What is Momentum?
Momentum measures the speed and strength of a price movement by comparing the current closing price to a previous close over a set period. In this indicator, it’s calculated as the difference between the current close and the close from a user-defined number of bars ago (default: 10). A rising momentum line indicates accelerating upward momentum, while a falling line suggests slowing momentum or a potential reversal. This helps you gauge whether a trend is gaining power or losing steam, making it a key indicator for spotting overbought or oversold conditions.
What is a Divergence?
A divergence occurs when the price action and the momentum indicator move in opposite directions, often signaling a potential trend reversal. The Momentum Divergence Oscillator highlights two types:
Bullish Divergence: When the price forms a lower low (indicating weakness), but the momentum shows a higher low (suggesting underlying strength). This can foreshadow an upward reversal.
Bearish Divergence: When the price reaches a higher high (showing strength), but the momentum records a lower high (indicating fading momentum). This may hint at an impending downward turn.
How the Indicator Works
The indicator plots a momentum line in a separate pane below your chart, giving you a clear view of price momentum over time. It also scans for divergences using adjustable lookback periods (default: 5 bars left and right) and a range window (default: 5-60 bars) to ensure relevance. When a divergence is detected, it’s visually highlighted, and you can customize the sensitivity through input settings like the momentum length and pivot lookback. Alerts are included to notify you of new divergence signals in real-time, saving you from constant monitoring.
How to Apply It
Identifying Opportunities: Use bullish divergences ("Bull") as a cue to consider long positions, especially when confirmed by support levels or a moving average crossover. Bearish divergences ("Bear") can signal short opportunities, particularly near resistance zones.
Combining with Other Tools: Pair this oscillator with indicators like the Relative Strength Index (RSI) or volume analysis to filter out false signals and increase confidence in your trades. For example, a bullish divergence with rising volume can be a stronger buy signal.
Timeframe Flexibility: Test it on shorter timeframes (e.g., 5-minute charts) for quick scalping trades or longer ones (e.g., 1-hour or 4-hour charts) for swing trading, adjusting the momentum length to suit the market’s pace.
Alert Setup: Enable the built-in alerts to get notified when a divergence forms, allowing you to react promptly without staring at the screen all day.
Strategy Example
Spot a bullish divergence on a 15-minute chart where the price hits a lower low, but the momentum rises.
Confirm with a break above a 20-period EMA and increasing volume.
Enter a long position with a stop-loss below the recent low and a take-profit near the next resistance level.
Customization Tips
Adjust the "Momentum Length" (default: 10) to make the oscillator more or less sensitive—shorter lengths react faster, while longer ones smooth out noise.
Tweak the "Pivot Lookback" settings to widen or narrow the divergence detection range based on your trading style.
Use the "Range Upper/Lower" inputs to focus on divergences within a specific timeframe that matches your strategy.
Important Considerations
b]This indicator is a technical analysis tool, not a guaranteed trading system. Always pair it with a solid strategy and strict risk management, such as setting stop-losses.
In strong trending markets, divergences can sometimes produce false signals. Consider adding a trend filter (e.g., ADX below 25) to avoid whipsaws.
Experiment with the settings on a demo account or backtest to find what works best for your preferred markets and timeframes.

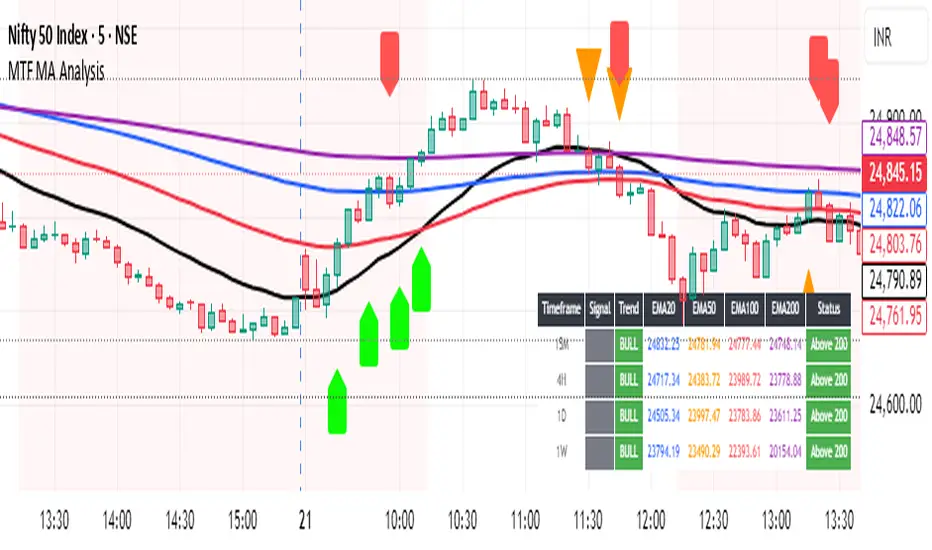
Multi-Timeframe MA Breakout/Breakdown Analysis📊 Overview
This sophisticated Pine Script indicator revolutionizes breakout/breakdown analysis by distinguishing between fake and genuine signals using a unique swing-level validation methodology. Unlike traditional moving average crossovers, this system validates price movements against historical swing points, providing traders with high-probability entry and exit signals across multiple timeframes.
🎯 Core Trading Methodology
The Swing Validation Concept:
Traditional MA breakouts often fail because they don't consider the context of previous price action. This indicator solves this by:
Recording swing levels when each MA is initially crossed
Validating subsequent crosses against these historical swing points
Classifying signals as fake or genuine based on this validation
Tracking signal evolution as price action develops
Signal Classification System:
🔻 Breakdown Analysis:
Fake Breakdown: Price cuts below MA but stays above the swing low from previous MA cut
Genuine Breakdown: Price cuts below MA and falls below the swing low from previous MA cut
Validation Chain: EMA 50 validates against EMA 20 swing low, EMA 100 against EMA 50 swing low, EMA 200 against EMA 100 swing low
🔺 Breakout Analysis:
Fake Breakout: Price crosses above MA but stays below the swing high from previous MA cross
Genuine Breakout: Price crosses above MA and exceeds the swing high from previous MA cross
Validation Chain: EMA 50 validates against EMA 20 swing high, EMA 100 against EMA 50 swing high, EMA 200 against EMA 100 swing high
📈 Signal Interpretation Guide
Visual Chart Signals:
Breakdown Signals:
🔻 Orange Triangle Down + "FAKE BREAKDOWN": Potential reversal opportunity - price likely to bounce
🔻 Red Triangle Down + "GENUINE BREAKDOWN": Trend continuation - expect further downside
🔺 Lime Triangle Up + "BULLISH REVERSAL": Strong buy signal after fake breakdown validation
Breakout Signals:
🔺 Orange Triangle Up + "FAKE BREAKOUT": Potential reversal opportunity - price likely to decline
🔺 Dark Red Triangle Up + "GENUINE BREAKOUT": Trend continuation - expect further upside
🔻 Fuchsia Triangle Down + "BEARISH REVERSAL": Strong sell signal after fake breakout validation
Multi-Timeframe Analysis Table:
Signal Column Interpretation:
"FAKE BD" (Orange): Fake breakdown detected - watch for bullish reversal
"GENUINE BD" (Red): Genuine breakdown - bearish continuation likely
"FAKE BO" (Orange): Fake breakout detected - watch for bearish reversal
"GENUINE BO" (Dark Red): Genuine breakout - bullish continuation likely
"BULLISH" (Lime): Bullish reversal confirmed - strong buy signal
"BEARISH" (Fuchsia): Bearish reversal confirmed - strong sell signal
Trend Column:
"BULL" (Green): EMAs in bullish sequence (20>50>100>200)
"BEAR" (Red): EMAs in bearish sequence (20<50<100<200)
"SIDE" (Gray): Sideways/mixed EMA alignment
Status Column:
"Above 200" (Green): Price above 200 EMA - bullish bias
"Below 200" (Red): Price below 200 EMA - bearish bias
"At 200" (Gray): Price at 200 EMA - neutral
💡 Trading Strategies
Strategy 1: Fake Signal Reversal Trading
For Long Entries (Fake Breakdown Reversal):
Wait for fake breakdown signal (orange triangle down)
Confirm bullish reversal (lime triangle up) when price reclaims EMAs
Enter long on bullish reversal confirmation
Stop loss below the swing low that validated the fake breakdown
Target next resistance level or previous swing high
For Short Entries (Fake Breakout Reversal):
Wait for fake breakout signal (orange triangle up)
Confirm bearish reversal (fuchsia triangle down) when price falls below EMAs
Enter short on bearish reversal confirmation
Stop loss above the swing high that validated the fake breakout
Target next support level or previous swing low
Strategy 2: Genuine Signal Trend Following
For Trend Continuation Longs:
Identify genuine breakout (dark red triangle up)
Confirm higher timeframe alignment (4H/1D showing bullish trend)
Enter on pullback to broken resistance (now support)
Stop loss below the validation swing high
Target measured move or next major resistance
For Trend Continuation Shorts:
Identify genuine breakdown (red triangle down)
Confirm higher timeframe alignment (4H/1D showing bearish trend)
Enter on pullback to broken support (now resistance)
Stop loss above the validation swing low
Target measured move or next major support
Strategy 3: Multi-Timeframe Confluence
High-Probability Setups:
Align signals across timeframes (15M signal + 4H trend confirmation)
Look for confluence (multiple timeframes showing same signal type)
Prioritize higher timeframe signals for swing/position trades
Use lower timeframes for precise entry timing
⚠️ Risk Management Rules
Position Sizing:
Fake signal trades: Reduce position size (higher risk, higher reward)
Genuine signal trades: Standard position size (trend following)
Multi-timeframe confluence: Increase position size (higher probability)
Stop Loss Guidelines:
Fake breakdown longs: Stop below validation swing low
Fake breakout shorts: Stop above validation swing high
Genuine signals: Stop beyond the MA that was broken
Reversals: Stop beyond the reversal invalidation level
Take Profit Strategies:
Scale out at key resistance/support levels
Trail stops using the 20 EMA for trend following
Take partial profits at 1:2 risk/reward ratio
Let winners run on strong trend continuation signals
🔧 Best Practices
Signal Validation:
Wait for candle close before acting on signals
Check volume confirmation on breakouts/breakdowns
Consider market context (news, earnings, etc.)
Avoid trading during low liquidity periods
Timeframe Selection:
Scalping: 15M signals with 4H trend filter
Day Trading: 4H signals with 1D trend filter
Swing Trading: 1D signals with 1W trend filter
Position Trading: 1W signals for major moves
Market Conditions:
Trending Markets: Focus on genuine signals for continuation
Range-Bound Markets: Focus on fake signals for reversals
High Volatility: Reduce position sizes and widen stops
Low Volatility: Look for breakout setups with volume
📋 Advanced Tips
Signal Evolution Monitoring:
Watch for signal transitions (fake becoming genuine or vice versa)
Adjust positions when signal classification changes
Use alerts to stay informed of signal updates
Monitor multiple timeframes for comprehensive analysis
Confluence Factors:
Support/Resistance levels at signal points
Volume spikes on genuine signals
RSI divergences with fake signals
Fibonacci retracements at reversal points
Common Pitfalls to Avoid:
Don't chase signals after significant moves
Don't ignore higher timeframe trends
Don't overtrade on every signal
Don't neglect risk management rules
🎯 Quick Reference
Bullish Signals Priority:
Bullish Reversal (Lime) - Highest priority
Fake Breakdown (Orange) - High probability reversal
Genuine Breakout (Dark Red) - Trend continuation
Bearish Signals Priority:
Bearish Reversal (Fuchsia) - Highest priority
Fake Breakout (Orange) - High probability reversal
Genuine Breakdown (Red) - Trend continuation
Multi-Timeframe Hierarchy:
1W: Major trend direction
1D: Intermediate trend and swing levels
4H: Short-term trend and entry timing
15M: Precise entry and exit points
⚡ Pro Tip: The most powerful signals occur when fake signals reverse into genuine signals in the opposite direction, creating high-momentum moves with excellent risk/reward ratios.
Disclaimer: This indicator is for educational purposes. Always combine with proper risk management, additional technical analysis, and fundamental research before making trading decisions. Past performance does not guarantee future results.
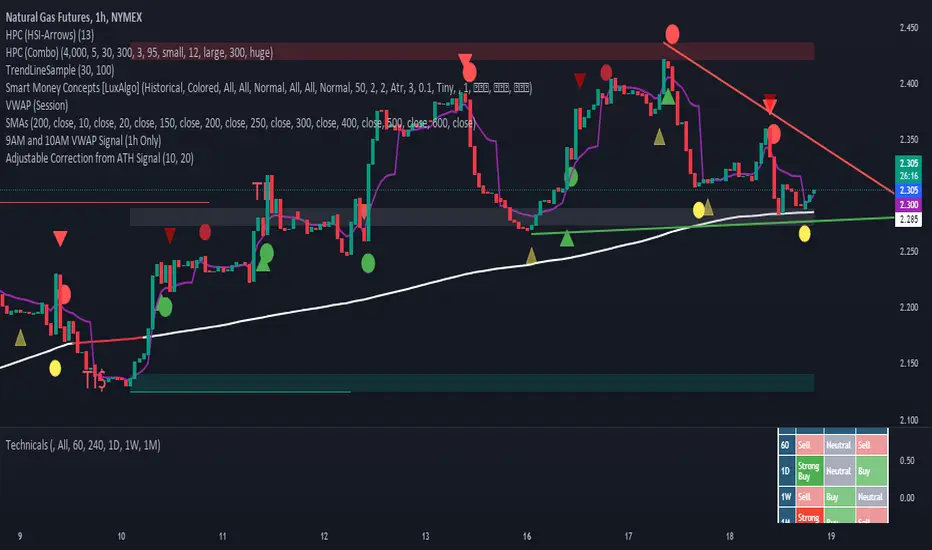
Adjustable Correction from ATH SignalA "Correction Signal from All-Time High" is an indicator used to identify potential reversals or pullbacks in an asset's price after it has reached its highest historical level, known as an all-time high (ATH). This signal typically occurs when the price begins to decline after hitting the ATH, suggesting a correction phase where the asset retraces part of its upward movement.
Key elements of this signal include:
Overbought Conditions: The asset may have experienced a strong rally leading to an overbought condition, where the price could be considered too high relative to recent trends.
Reversal Patterns: The correction signal is often accompanied by technical patterns or indicators that suggest a reversal, such as bearish candlestick formations, negative divergence in momentum indicators, or moving average crossovers.
Percentage Decline: A correction is generally defined as a price drop of at least 10% from the ATH, although smaller pullbacks may also signal potential market shifts.
Volume Analysis: Increased selling volume after the ATH can validate the correction signal, indicating that more market participants are taking profits or exiting positions.
This signal helps traders and investors anticipate periods of market consolidation or potential downturns after significant price advances, allowing for better risk management or entry points for new positions.
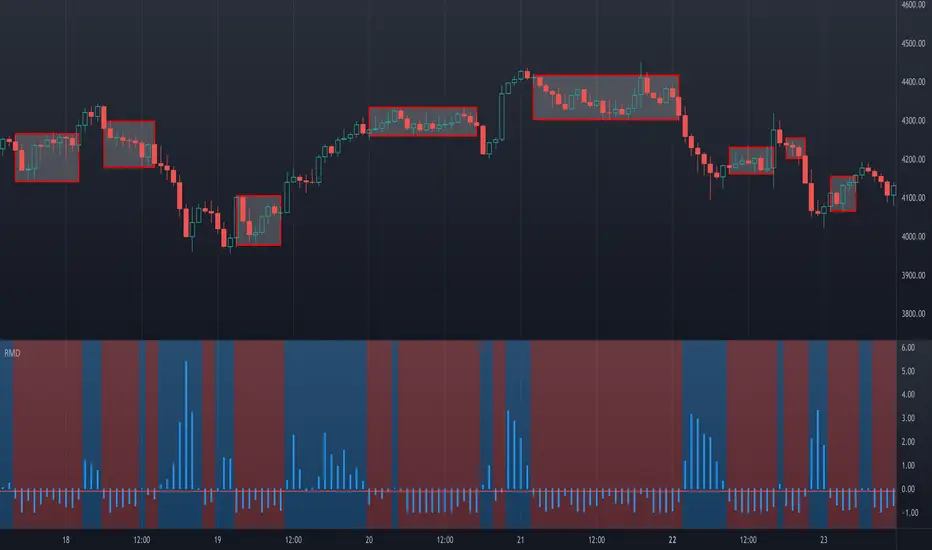
Ranges and Breakouts [AlgoAlpha]💥 Ranges and Breakouts by AlgoAlpha is a dynamic indicator designed for traders seeking to identify market ranges and capitalize on breakout opportunities. This tool automatically detects ranges based on price action over a specified period, visualizing these ranges with shaded boxes and midlines, making it easy to spot potential breakout scenarios. The indicator includes advanced features such as customizable pivot detection, internal range allowance, and automatic trend color changes for quick market analysis.
Key Features
💹 Dynamic Range Detection : Automatically identifies market ranges using customizable look-back and confirmation periods.
🎯 Breakout Alerts : Get alerted to bullish and bearish breakouts for potential trading opportunities.
📊 Visual Aids : Displays pivot highs/lows within ranges and plots midlines with adjustable styles for easier market trend interpretation.
🔔 Alerts : Signals potential take-profit points based on volatility and moving average crossovers.
🎨 Customizable Appearance : Choose between solid, dashed, or dotted lines for midlines and adjust the colors for bullish and bearish zones.
How to Use
⭐ Add the Indicator : Add the indicator to favorites by pressing the star icon. Adjust the settings like the look-back period, confirmation length, and pivot detection to match your trading strategy.
👀 Monitor the Chart : Watch for new ranges to form, highlighted by shaded boxes on the chart. Midlines and range bounds will appear to help you gauge potential breakout points.
⚡ React to Breakouts : Pay attention to color changes and alert signals for bullish or bearish breakouts. Use these signals to enter or exit trades.
🔔 Set Alerts : Customize alert conditions for new range formations, breakout signals, and take-profit levels to stay on top of market movements without constant monitoring.
How It Works
The indicator detects price ranges by analyzing the highest and lowest prices over a specified period. It confirms a range if these levels remain unchanged for a set number of bars, at which point it visually marks the range with shaded boxes. Pivots are identified within these ranges, and a midline is plotted to help interpret potential breakouts. When price breaks out of these defined ranges, the indicator changes the chart's background color to signal a bullish or bearish trend. Alerts can be set for range formation, breakouts, and take-profit opportunities, helping traders stay proactive in volatile markets.

Squeeze Momentum Strategy [LazyBear] Buy Sell TP SL Alerts-Modified version of Squeeze Momentum Indicator by @LazyBear.
-Converted to version 5,
-Taken inspiration from @KivancOzbilgic for its buy sell calculations,
-Used @Bunghole strategy template with Take Profit, Stop Loss and Enable/Disable Toggles
-Added Custom Date Backtesting Module
------------------------------------------------------------------------------------------------------------------------
All credit goes to above
Problem with original version:
The original Squeeze Momentum Strategy did not have buy sell signals and there was alot of confusion as to when to enter and exit.
There was no proper strategy that would allow backtesting on which further analysis could be carried out.
There are 3 aspects this strategy:
1 ) Strategy Logic (easily toggleable from the dropdown menu from strategy settings)
- LazyBear (I have made this simple by using Kivanc technique of Momentums Moving Average Crossover, BUY when MA cross above signal line, SELL when crossdown signal line)
- Zero Crossover Line (BUY signal when crossover zero line, and SELL crossdown zero line)
2) Long Short TP and SL
- In strategies there is usually only 1 SL and 1 TP, and it is assumed that if a 2% SL giving a good profit %, then it would be best for both long and short. However this is not the case for many. Many markets/pairs, go down with much more speed then they go up with. Hence once we have a profitable backtesting setting, then we should start optimizing Long and Short SL's seperately. Once that is done, we should start optimizing for Long and Short TP's separately, starting with Longs first in both cases.
3) Enable and Disable Toggles of Long and Short Trades
- Many markets dont allow short trades, or are not suitable for short trades. In this case it would be much more feasible to disable "Short" Trading and see results of Long Only as a built in graphic view of backtestor provides a more easy to understand data feed as compared to the performance summary in which you have to review long and short profitability separately.
4) Custom Data Backtesting
- One of most crucial aspects while optimizing for backtesting is to check a strategies performance on uptrends, downtrend and sideways markets seperately as to understand the weak points of strategy.
- Once you enable custom date backtesting, you will see lines on the chart which can be dragged left right based on where you want to start and end the backtesting from and to.
Note:
- Not a financial advise
- Open to feedback, questions, improvements, errors etc.
- More info on how the squeeze momentum works visit LazyBear indicator link:
Happy Trading!
Cheers
M Tahreem Alam @mtahreemalam

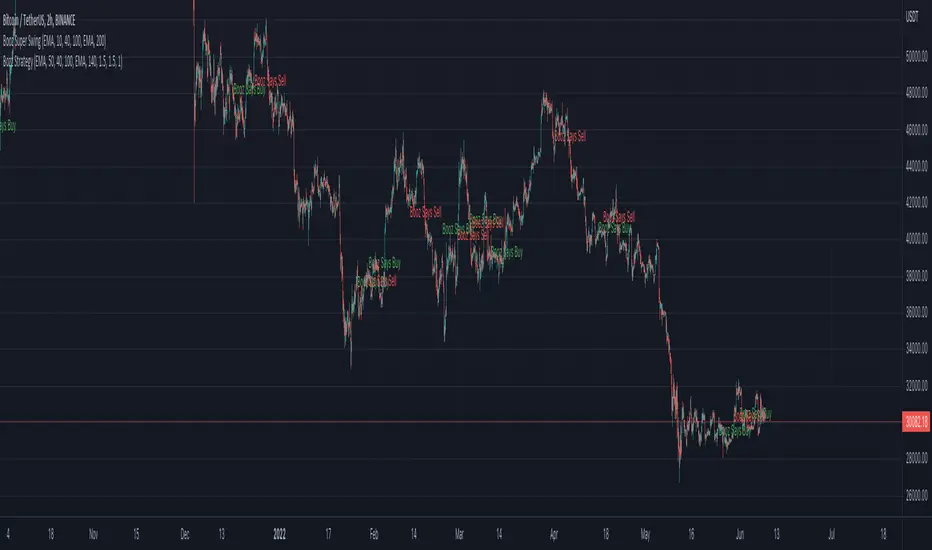
Booz StrategyBooz Backtesting : Booz Backtesting is a method for analyzing the performance of your current trading strategy . Booz Backtesting aims to help you generate results and evaluate risk and return without risking real capital.
The Booz Backtesting is the Booz Super Swing Indicator equivalent but gives you the ability to backtest data on different charts.
This is an Indicator created for the purpose of identifying trends in Multiple Markets, it is based on Moving Average Crossover and extra features.
Swing Trading: This function allows you to navigate the entire trend until it is not strong enough, so you can compare it with fixed parameters such as Take Profit and Stop Loss.
Take Profit and Stop Loss function: With this function you will be able to choose the most optimal parameters and see in real time the results in order to choose the best combination of parameters.
Leverage : We have this function for the futures markets where you can check which is the most appropriate leverage for your operation.
Trend Filter: allows you to take multiple entries in the same direction of the market.
If the market crosses below the 200 moving average, it will take only short entries.
If the market crosses above the 200 moving average, it will take only long entries.
Timeframes
Charting from 1 Hour, 4 Hour, Daily, Weekly, Weekly
Markets :Booz Backtesting can be tested in Cryptocurrency, Stocks and Futures markets.
Background Color : at a glance, you can see what cycle the market is in.
Green background : Shows that the market is in a bullish cycle.
Red background: Shows that the market is in a bearish cycle.

Booz Super SwingBooz Super Swing is an Indicator created for the purpose of identifying trends in Multiple Markets, it is based on Moving Average Crossover and extra features.
Trend Filter: allows you to take multiple entries in the same direction of the market.
If the market crosses below the 200 moving average it will take only short entries.
If the market crosses above the 200 moving average it will take only long entries.
Background Color : at a glance, you can see what cycle the market is in.
Green background : Shows that the market is in a bullish cycle.
Red background: Shows that the market is in a bearish cycle.
Markets : Booz Super Swing can be used and has been tested in Cryptocurrency, Stocks and Futures markets.
Timeframes
Charting from 1 Hour, 4 Hour, Daily, Weekly, Weekly
Weak Point :
Are Sideways Markets
Alarms :
Buy : Allows you to notify and automate entries based on market detection.
Sell : Allows you to notify and automate entries based on market detection.
Bozz Strategy
Booz Backtesting : Booz Backtesting is a method for analyzing the performance of your current trading strategy . Booz Backtesting aims to help you generate results and evaluate risk and return without risking real capital.
The Booz Backtesting is the Booz Super Swing Indicator equivalent but gives you the ability to backtest data on different charts.
This is an Indicator created for the purpose of identifying trends in Multiple Markets, it is based on Moving Average Crossover and extra features.
Swing Trading: This function allows you to navigate the entire trend until it is not strong enough, so you can compare it with fixed parameters such as Take Profit and Stop Loss.
Take Profit and Stop Loss function: With this function you will be able to choose the most optimal parameters and see in real time the results in order to choose the best combination of parameters.
Leverage : We have this function for the futures markets where you can check which is the most appropriate leverage for your operation.
Trend Filter: allows you to take multiple entries in the same direction of the market.
If the market crosses below the 200 moving average, it will take only short entries.
If the market crosses above the 200 moving average, it will take only long entries.
Timeframes
Charting from 1 Hour, 4 Hour, Daily, Weekly, Weekly
Markets :Booz Backtesting can be tested in Cryptocurrency, Stocks and Futures markets.
Background Color : at a glance, you can see what cycle the market is in.
Green background : Shows that the market is in a bullish cycle.
Red background: Shows that the market is in a bearish cycle.
Twitter
Website

Dynamic length MA Strategy [Dynamic Signal Lab]Dear TV'ers,
Hereby the strategy for the dynamic moving average crossover, with some flexible taking profit options.
All moving averages have the option to dynamically change lengths and different source options. They include:
* Hull MA
* volume-weighted Hull MA
* Simple MA
* Money Flow Index
* Chande Momentum Oscilator
* Arnaud Legoux MA
* Weighted MA
* Linear regression
What makes this strategy special is the fact that you can dynamically shorten the length of moving average length depending on how much you are in profit. The more you are in profit, the shorter the length of the MA will become.
The current default properties should be modified to make this strategy cost-effective, but typically 30minutes and higher timeframes seem to work well for larger (top10 cap) crypto projects. Dont use this script for small-caps as it will get you rekt.
Additionally, you'll also be able to continuously take profit, making sure you lock in all those sweet profits.
Use this script for doing backtesting and the indicator compagnon to fire your alerts.

Ranging Market Detector [AstrideUnicorn]Determining if the market is in a trend or a range regime is a very complex problem. And knowing the answer can be, in some situations, the real holy grail. If the trader knows when the market is in a range regime, they can avoid overtrading and make moving average crossover strategies more profitable. A regime switch from a trend to a range can be a signal to close open positions. It can also be helpful when trading such instruments as short-term binary options. When the market is ranging directional moves are not expected, and the trader should be careful as opening a position in such conditions is, by some degree, a random outcome game. Range breakouts trading is one more example when knowing the market regime is critical.
We have created an indicator that predicts the current market regime. It smooths the price using the Kalman filter and analyzes the curve's slope. If the absolute value of the slope is low, then the market is in range mode and vice versa. To distinguish between the two regimes, the algorithm compares the absolute value of the slope with its long-term average.
HOW TO USE
The indicator shows the difference between the absolute slope value and its long-term average as a histogram. When a bar of the histogram is higher than the threshold level presented by the red line, the market is in a trending regime. In this regime, the background of the indicator is blue. When the market is in a range regime, the indicator background turns red.
The threshold level helps to control the lag. The greater it is, the more lagging the indicator will be. By default, this value is set to a negative value. It means that the indicator switches from range to trend a little bit earlier than the slope gets higher than the average slope. You can use the value of zero or low negative values to find the optimal tradeoff between the strength of the signals and their lag.
SETTINGS
The indicator has one input parameter called Threshold. It sets the threshold level described above. Its value should be close to zero. The less the value is, the less is the indicator's lag, but at the same time, the less confirmed the regime-switching signals are.
The use cases can be very different. And as the code is open, you can also use the indicator as a building block for your custom trading strategies.
Let us know your thoughts and suggestions!
Double Top/Bottom V2This is an enhanced version of Double Top/Bottom detector.
Initial basic version can be found here:
Concept of deriving pattern is similar but there are few major changes.
Double Top:
Get the highest pivot high from last X pivot highs ( DTHigh1 )
Look for next top most pivot high which happened after DTHigh1 ( DTHigh2 )
Look for lowest pivot low between DTHigh1 and DTHigh2 ( DTLow )
Double Bottom:
Get the lowest pivot low from last X pivot lows ( DBLow1 )
Look for next lowest pivot low which happened after DBLow1 ( DBLow2 )
Look for highest pivot high between DBLow1 and DBLow2 ( DbHigh )
Other Key parameters:
checkForAbsolutePeaks and absolutePeakLoopback work together. When selected, double top and double bottom is formed only if DTHigh1 / DBLow1 are highest/lowest points from last absolutePeakLoopback bars back.
considerPivotDistance will make sure distance between Highs(in double top) and lows(in double bottom) are below 2 ( MaxAtrDistanceBase ) times ATR. And distance between average Highs/Lows to Low/High forming triangle is less than 6 ( MaxAtrDistanceHighLow ) times ATR. This will avoid showing steep triangles as double top/bottoms.
showLastLevels option allows users to display dashed lines on double top/bottom confirmation and invalidation levels for last formed double bottom and tops. These can be treated as strong support and resistence. Dashed lines are permanently formed on double top/bottom setups when an invalidation or confirmation occurs by price crossing either lowest or highest points of double top/bottom triangles.
Alerts:
Probable double top/bottom - when double top or bottom triangles formed.
Double top/bottom confirmation - when double top or bottom is confirmed.
Double top/bottom invalidation - when double top or bottom is invalidated.
Few important points about adjusting parameters:
Lower pivot lengths will generate more signals. But, too frequent signals may not be desirable as well.
higher absolutePeakLoopback will reduce number of signals while strengthening them.
Unchecking consider pivot distance or reducing MaxAtrDistanceBase/MaxAtrDistanceHighLow may considerably increase the number of pivots specially when pivot lengths are lower side. This may result in reduced quality of signals as well.
Moving average condition which is part of basic script is not included in this. We can add Hull Suite or moving average crossover on the chart as confirmation of strong signal.

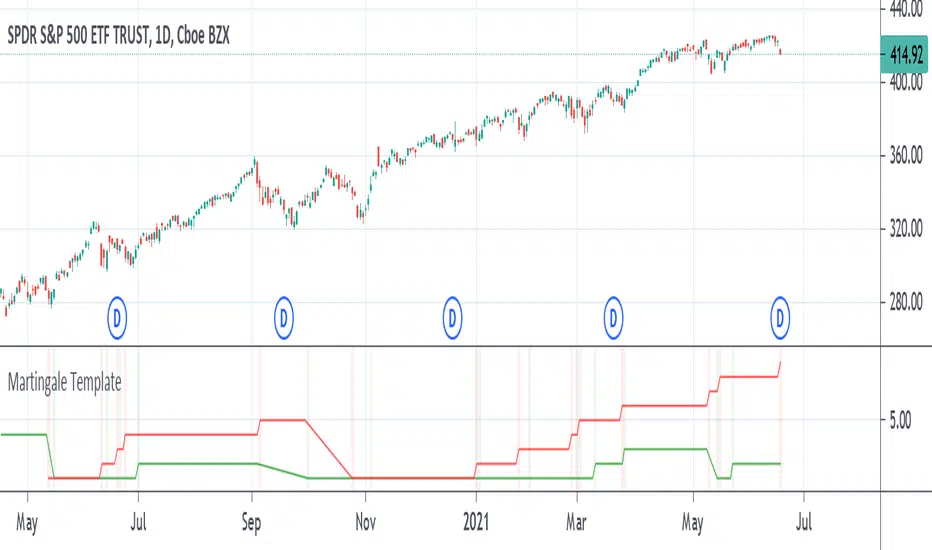
Martingale TemplateA template example on how to apply the famous Martingale gambling strategy. When your strategy gets an exit signal for your long position that leaves you without profit, you re-enter on the next entry long condition with double the capital of the previous amount entered with. You keep doubling the amount of capital entered with until you finally exit with a profit. If the strategy isn't sound enough then it could take several attempts and it can take only as much as a dozen tries to eat away at all your capital as the capital required to double on the next entry increases greatly over time by consecutive products of 2.
The strategy used is just a simple moving average crossover, above the moving average is going long, below the moving average is going short. It can be replaced with whatever strategy that you want. The colored vertical bars show long and short positions and exits. The default option on the tick box under the settings show the number of attempts at entering before finally exiting with a profit, the other option shows the amount of capital it took starting from 1.
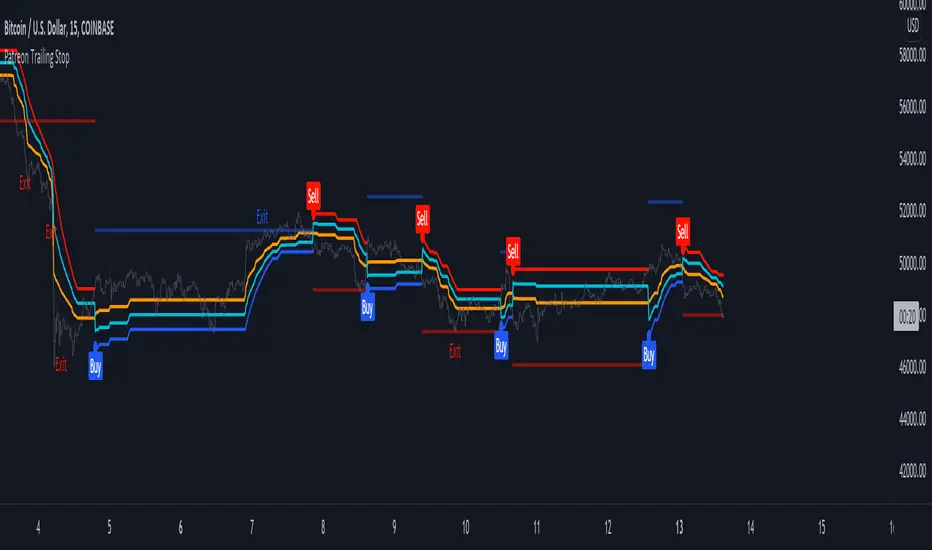
Patreon Trailing StopThe Patreon trailing stop technical indicator can detect trends, find support and resistance points, filter out noise, and help users make informed decisions easily and in a timely manner. In order to provide an accurate and useful indicator most of the efforts during its development were directed toward the minimization of false signals, thus giving to the indicator the potential to further improve your trading strategies.
The trailing stop integrates visual elements for an easier interpretation of the indicator, and integrate alerts based on the buy/sell signals given by the trailing stop. All the outputs of the indicator can be used as input for other indicators.
Settings
In order to make it easier to use, the indicator only possess three user settings:
Length: Control the sensitivity to price variations, with a higher value aiming to detect longer-term trends.
Factor: A setting that aims to filter out false signals, with a higher value filtering more false signals.
Src: Source input of the indicator, by default set to median price (hl2).
Easily Filter Out False Signals
The Factor setting was carefully implemented to filter out false signals without introducing significant delay.
In green/orange the indicator with a Factor setting of 1, in blue/red the indicator with a Factor setting of 10, both using Length = 50 , we can see that increasing factor remove false signals.
The integrated support and resistance line can also help you spot potential false signals:
When the price cross the S/R line before the occurrence of a signal we could expect the upcoming signal to be false, better signals are given when the price cross the S/R at the same time a signal is produced.
Finally, the distance between the trailing stop and the price when a new signal occurs can also help out determine if this signal is false, as a higher distance between the trailing stop and the price suggest a ranging market.
Entering Trades At A Better Position
Indicators can give false signals at the top or bottom of a movement, the Patreon trailing stop can help you enter trades at a more profitable position thanks to the integrated support and resistance line.
When we have a signal but fear it might be false, we can wait for the price to reach the S/R and enter our trade at that point, this allows us to either make a profit or minimize a loss.
Integrated Adaptive Filter
The indicator integrates a trend adaptive filter (in orange), with it you can:
Filter out noisy variations from the price.
Use it as a fast-moving average in a moving average crossover system.
Use it as input for other technical indicators.
Simple moving average with period 200 using the filter as input.
How To Access
The indicator is one of the "Patreon trend following indicators", and can only be used by my Patreons, you can become a Patreon by using the link on my signature.
Bull/Bear Probability [Anan]Hello Friends,,,
===================================
This indicator is based on Bayes' Theorem and is fully based on probabilities.
===================================
Formula For Bayes' Theorem:
P(Bull|Bear) = P(Bear∣Bull) * P(Bull) / P(Bear)
where:
Bull and Bear are events and P is probability
P(Bull|Bear) is the posterior probability, the probability of Bull after taking into account Bear
P(Bear∣Bull) is the conditional probability or likelihood, the degree of belief in Bear given that proposition of Bull belief (Bull true)
P(Bull) is the prior probability, the probability of Bull belief
P(Bear) is the prior probability, the probability of Bear belief
===================================
The indicator output 2 trend lines and (Bull/Bear) Signal :
Bull/Bear Probability Trend :
when the price is above it = Up Trend
when the price is below it = Down Trend
Bull/Bear Probability Trend Moving Average :
when the price is above it = Up Trend
when the price is below it = Down Trend
(Bull/Bear) Signal :
when Probability Trend Moving Average crossover Probability Trend = Bull Signal
when Probability Trend Moving Average crossunder Probability Trend = Bear Signal
===================================
Disclaimer:
This script is for informational and educational purposes only.
Use of the script does not constitutes professional and/or financial advice.
You alone the sole responsibility of evaluating the script output and risks associated with the use of the script.
===================================
Thanks to my friends dgtrd because he inspired me about probability, take a look at his scripts.
===================================

unRekt - KISS CrossKISS Cross is a moving average crossover and is part of the ''keeping it simple' series that have a similar color scheme. With this indicator you can select the moving average you'd like to use either SMA, EMA, WMA, or VWMA. Each moving average can be turned on or off and input changed. The first two MA's will change color on the cross from green to red depending on cross up or a cross down.

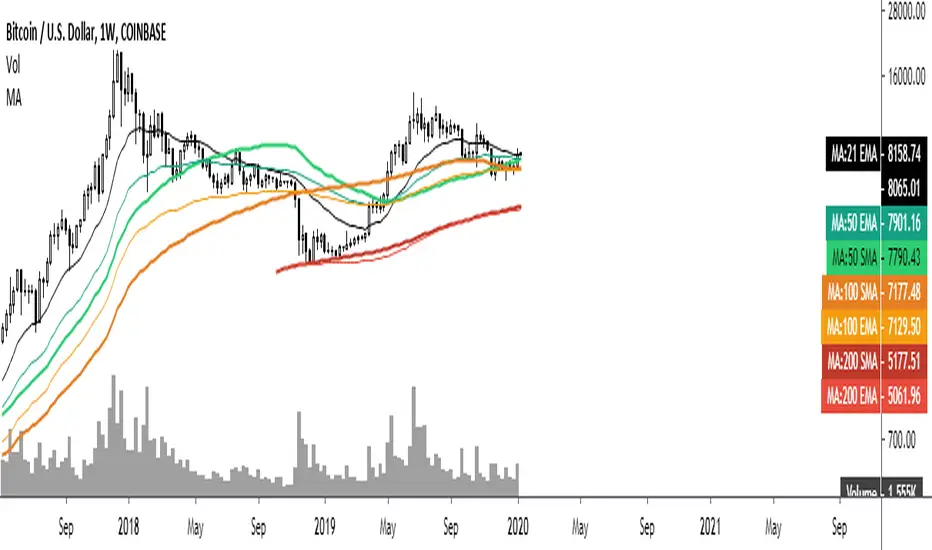
Common Moving averages ( 4 EMA + 3 SMA)Common moving averages used are included in the script. Customize them as per your wishes.
MA's set as default are
21 EMA
50 EMA , SMA
100 EMA , SMA
200 EMA , SMA
Please favorite it if you like it! Thanks!
RSI EMA CrossOver RameshThe RSI is one of the most popular technical indicators. The RSI measures the internal strength of the security. The RSI indicator oscillates between oversold and over bought levels, where a trader is advised to look for buying opportunities when the stock is in over sold region and selling opportunities when the stock is in over bought region.
The RSI with EMA strategy signals a trade when EMA of 7 period RSI crosses over the EMA of a 14 period RSI.
Buy: when 10 EMA of 7 period RSI crossing up 10 EMA of a 14 period RSI
Sell: when 10 EMA of 7 period RSI crossing down 10 EMA of a 14 period RSI
EMA = Exponential Moving Average
Crossover = Simple crossover between current RSI values and its 10 day EMA

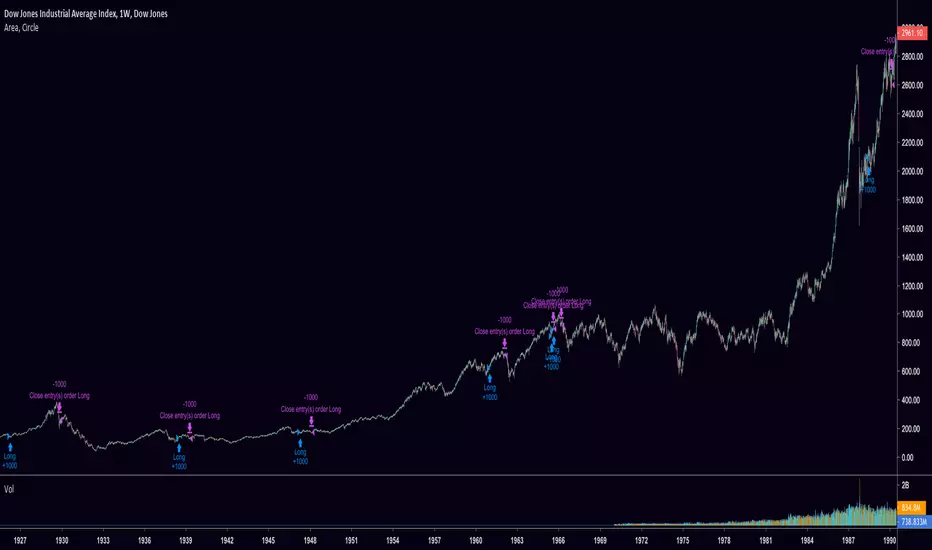
Area, CircleThis script calculates the area of a circle (A) at moving average crossover points. When A is above a specified threshold, the strategy analyzes moving average positioning, percentile linear interpolation of the distance between moving averages, volatility windows, among other conditions to determine long and short entries. On higher timeframes, the strategy appeared to have utility on higher timeframes for equities markets.
The source code is for sale, DM with an offer to begin negotiations.
[Backtest Crypto] Cross MAThis script is designed for testing the moving average crossover strategy.
Script settings:
Select testing range
Indicator settings: Select moving average type (EMA, SMA, WMA, SMMA, HMA) and period
Trade management: Select risk-to-reward ratio, stop-loss defined as min/max for a certain number of candles (you can set a desired number), option to partially lock in a position by moving the stop-loss to breakeven, trailing stop, or close a position on an opposite signal.
Option to limit the stop-loss by ATR to prevent it from becoming too large during volatile movements.
===============================================================
Скрипт предназначен для тестирования стратегии пересечение скользящих средних.
Настройки скрипта:
Выбор диапазона тестирования
Настройки индикатора: выбор типа скользящей (EMA, SMA, WMA, SMMA, HMA) и периода
Сопровождение сделки: выбор соотношения риска к прибыли, стоп-лосс определяется как мин/мах за определенное количество свечей (можно устанавливать желаемое количество), возможность частичной фиксации позиции с переносом стоп-лосса в безубыток, трейлинг-стоп, или закрытие позиции по противоположному сигналу.
Возможность ограничения стоп-лосса по ATR, чтобы при волатильных движениях он не был слишком большим.

Vega Convexity Regime Filter [Institutional Lite]STOP TRADING THE NOISE.
90% of retail trading losses occur during "Chop"—sideways markets where standard trend-following bots bleed capital through slippage and fees. Institutional desks know that the secret to high returns isn't just winning trades; it's knowing when to sit in cash.
The Vega V6 Regime Filter is the "Gatekeeper" layer of our proprietary Hierarchical Machine Learning engine (developed by a 25-year TradFi Risk Quant). It calculates a composite volatility score to answer one simple question: Is this asset tradeable right now?
THE VISUAL LOGIC
This indicator visually filters market conditions into two distinct Regimes based on our institutional backtests:
🌫️ GREY BARS (Noise / Chop)
The State: Volatility is compressing. The trend is undefined or weak.
The Trap: This is where MACD/RSI give false signals.
Institutional Action: Sit in Cash. Preserve Capital. Wait.
🟢 🔴 COLORED BARS (Impulse)
The State: Volatility is expanding. Momentum is statistically significant.
The Opportunity: A "Fat-Tail" move is likely beginning.
Institutional Action: Deploy Risk. Look for entries.
HOW IT WORKS (The Math)
Unlike simple moving average crossovers, the Vega Gatekeeper analyzes 4 distinct market dimensions simultaneously to generate a Tradeability Score (0-10) :
Trend Strength (ADX): Is there a vector?
Momentum (RSI/MACD): Is the move accelerating?
Volatility (Bollinger Bands): Is the range expanding?
Volume Flow: Is there institutional participation?
The Rule: If the composite score is < 4 , the market is Noise. The bars turn Grey. You do nothing.
BEST PRACTICES
For Swing Trading (Daily): Use Medium sensitivity. Only look for entries when the background turns Green/Red.
For Day Trading (4H/1H): Use Low sensitivity (more conservative). Use the Grey zones to tighten stops or exit positions.
THE PHILOSOPHY: "CASH IS A POSITION"
Most traders feel the need to be in a trade 24/7. The Vega V6 Engine (the system this tool is based on) achieved a +3,849% backtested return (18 months) largely by sitting in cash during chop. This tool visualizes that discipline.
🔒 WANT THE DIRECTIONAL SIGNALS?
This Lite version provides the Regime (When to trade).
To get the specific Entry Signals , Intraday Stop-Losses , and Probability Matrix (Stage 2 of our model), you need the Vega V6 Convexity Engine .
The Pro Version includes:
🚀 Specific Direction: Classification of "Explosion," "Rally," or "Crash."
🛡️ Dynamic Risk: Plots the exact Stop Loss levels used in our institutional backtests.
🌊 Macro Data: Integration of M2 Liquidity flow alerts.
👉 ACCESS INSTRUCTIONS:
Links to the Pro System , our Live Dashboard , and the 18-Month Performance Audit can be found in the Author Profile below or in the script settings.
Disclaimer: This tool is for educational purposes only. Past performance is not indicative of future results. Trading cryptocurrencies involves significant risk.
